
A Strava-based Forecast
By Michael O.B. Krähe
January 28th, 2018

Introduction
The road racing bicycle market is a very small segment of the overall bicycle market and accounts for 5% or less of the total market size in terms of units. Nevertheless, it is an interesting segment, as innovation in road racing bicycles, such as (electronic) gear shifting, disc brakes or carbon fiber frames tend to trickle down into other segments, such as trekking or city bikes over the years.
The last ten years have been very successful ones for the manufacturers of racing bikes as the market continued to expand; road racing has become popular in many countries of the world and was sometimes described as the “new golf”. This is due to the fact, that rather than children or young adults, picking up a bike and learning to race, people in their forties and fifties have discovered cycling as a viable alternative to other kinds of sports. As this group possess ample financial means to support their hobbies, more and more expensive bikes with advanced technology could be sold by the makers. Which in turn led to more innovation and many new, young brands showing up in the marketplace.
However, observers of industry news could note since 2016, that the peak has been reached and that sales have become more sluggish since then. The biggest bike component makers such as Shimano, Sram and Campagnolo have published decreased sales and profits figures and some of the smaller brands have either exited the market (for example American Classics in January 2018), filed for bankruptcy (Niner) or were acquired (Felt by Rossignol and Eddy Merckx by Ridley) by other companies. Partly also by private Investors (Rapha by RZC Investments) or by other industries (Pinarello by LVMH).
This article forecasts the behavior of the global racing bicycle market based on an analysis of data available to the public by Strava, a social network that collects data about bicycle rides uploaded by users worldwide.
![]()
Strava as Data source
A road racing bike needs to be purchased by an individual who then uses his bike to ride alone or with friends during his free time and occasionally attends open races or organized tours. The more a racing bike is used, the more likely it is that the user will decide to buy a newer, more technological advanced model. These “heavy users” create a small, constant demand in the market. The major driving force however are beginners, who buy a bicycle for the first time. These buyers may or may not decide to ride often, thus becoming „heavy users“ or „non-users“ with their bikes being stored in the basement and no further purchases planned. Heavy users so not create significant market growth, beginners do.
Racing is all about competition, in other words to compare one’s own performance against others. Traditionally this is done in races, which has the disadvantage that it can be done only infrequently at specific time and place. This is where Strava comes in. Strava, founded in 2009 and based in San Francisco, has created a web-based application where members can upload data from their rides which are recorded either by dedicated devices from makers such as Garmin or Wahoo, or by smart phones equipped with GPS.
Users define “segments” which are stretches of roads with start and finishing points and compare the time it has taken them to ride with other Strava users that have recorded their ride on the same segment. Apart from the competitive aspect, where users can decide whether to engage in a “race against all others” on a segment, there is also a social aspect as users can see where their friends and acquaintances have ridden recently.
The data gathered by Strava in the nine years since their establishment is quite astonishing. Strava has recently released a “Global Heat Map” in September 2017 based on the data of more than one billion rides. The map displays roads which are heavily frequented by Strava users in glowing yellow; the more the roads are used, the bigger and brighter are the related colors. Looking at the map one can easily see where globally most people ride racing bikes. And this give a good indication where most road racing bikes are globally sold.

Strava Heat Map – September 2017
It is fair to assume that Strava Users are “Heavy Users” in the racing bike market segment. Naturally not all riders are using Strava, nor is there a direct relation between recording rides and buying road racing bikes. However, it is fair to assume that countries in which are a high number of rides recorded in Strava are important road racing bike market, whereas countries shown dark on the map are not. A major exception are however popular bike holiday destinations such as Thailand. Rides in Thailand are recorded on the roads of Thailand, however Strava users may reside in other countries.
A first glance on the map does not offer surprises: The US; Europe and Japan are the nations with the highest number or rides, thus with the biggest markets. People in large parts of South America, Africa and Asia do not record their rides on Strava and in consequence these countries are also not attractive markets. Surprisingly neither China nor India seem to be attractive markets despite their huge populations. It should be noted that this is the case although Strava is offered besides English in many other languages, among them Chinese, Russian, Spanish and Portuguese. It could also be argued, that Strava hasn’t penetrated the race bike cycling communities in many countries in the same degree as it has in the US and Europe.
Strava data can be compared over time, this is possible by looking at data in the form of “Challenges”. Riders are asked to do a certain number of kilometers between defined dates. If they achieve their goal, they are presented with virtual badges on their Strava profile. This provides additional motivation to many users. One of the major challenges on Strava is the Festive 500, sponsored by the cycling apparel maker Rapha from the UK since 2013. The goal of the Festive 500 Challenge is to ride 500 km between Christmas and New Year and each year ten thousands of riders from all over the world are registering for the challenge. The data of Festive 500 provides therefore an easily available, significant and representative data sample of global road racing activities as outlined previously. Data is publicly available for all challenges between 2013 and 2017; this data was used to analyze the riding activities in selected countries and to show trends over time.
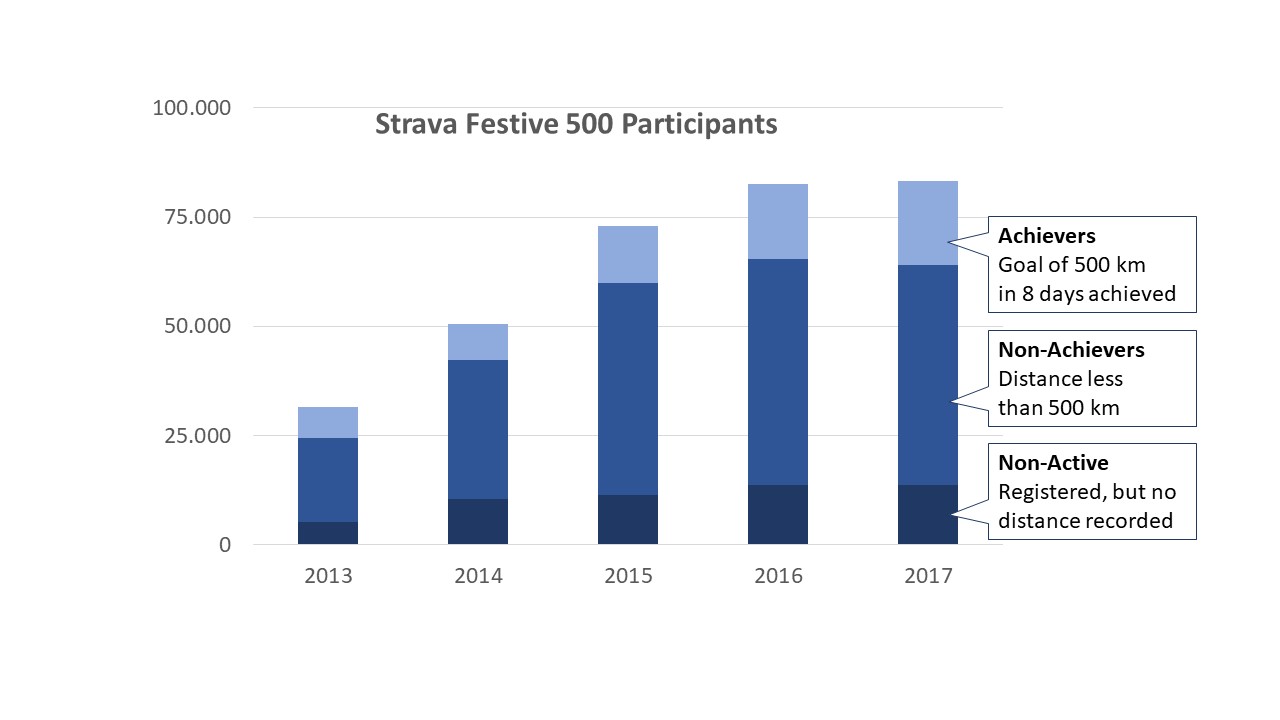
Global Strava Rides and Global Racing Bike Market
83,181 riders registered in 2017 for the Festive 500 challenge on Strava. Out of this total 13,587 riders did not ride a single kilometer. The remaining 69,594 active riders rode a total of 19,867,129 kilometers and 19,139 of them (“Achievers”) rode more than 500 km, thus achieving the goal of the challenge. Although these are impressive numbers, one needs to compare them with the previous Festive 500 challenges between 2013 and 2016.
2017 was the year with the highest number of registrations, kilometers completed, active riders and achievers since the start of the challenge. However, the growth in all numbers has significantly slowed down. There were only 0,7% more registration in 2017 compared to 2016, whereas there has been double digit growth in previous years. This is not only true for registrations, but also for completed kilometers (plus 2.9%) and active riders (plus 0.9%). The exception is the number of achievers, which has increased by 12%. Thus we conclude, that either the growth in Strava penetration rate has slowed down, or that the growth in number of riders has slowed down, or both. Those who have chosen to ride, rode longer and more of them have achieved their goal. So, it is fair to conclude that more heavy users are among the riders who have registered for the Festive 500 challenges and less beginners and in consequence that there are less people starting to ride road racing bikes, thus a shrinking market.
There is a concept in environmental studies called “Peak Oil” which could provide a good analogy to what is happening today on Strava. Peak Oil basically states, that long before natural oil reserves have completely dried up, the production of oil will reach its maximum and thereafter the production rates will continue to fall. This is mainly because the discovery of new reserves and their subsequent exploitation will not continue at the same pace as the demand for oil increases worldwide. Since its conception in the fifties peak oil has been forecasted as early as 1974, then revised to 1995, but as a matter of fact oil production has increased until 2015 and an end is not in sight.
To put this in relation: Strava usage will further grow as long as beginners are buying bikes (discovery of new reserves) and start to use Strava (exploitation of reserves).
One can analyze the development of Strava based on the peak oil concept. An increase of Strava usage is due to
- A) newcomers taking up the sport and
- B) riders discovering Strava as a useful tool.
A) is based on market growth (newcomers) and B) is based on Strava penetration rate.
A decrease in Strava usage is due to
- C) people quitting cycling sports and
- d) people quitting Strava.
The former is more likely than the later, as Strava has, just as facebook, some kind of addictive characteristics. In extreme cases Strava motivated to start doping to enhance their performance on Strava; caused a deathly accident and website offer cheats to digitally enhance the performance of users.
However, whereas other social networks such as WhatsApp, snapchat or line offer feasible alternatives to Strava, there is virtually no competition to Strava. In terms of cycling social networks, Strava enjoys a monopoly like Windows in the PC market. Thus, a decrease in Strava usage is rather based on less people riding than on less people using Strava.
Based on the data available, we conclude that Strava will reach its peak in 2018. This claim can be verified by looking at detailed data from the major global bike markets. 55% of all riders registered for the Festive 500 Challenge come from only 13 countries with the UK, USA, Australia and Brazil accounting for 35%. In all four countries participation has been lower in 2017 compared to 2016.

So, in major bike markets, where Strava penetration is already high, the supply of new riders has dried up and more and more people are quitting cycling, leading to an overall decrease.
The same is basically true for the following nine markets, notably Spain, Japan, Italy, Germany, France, the Netherlands, Belgium, South Africa and Portugal. In all markets, with he exception of the Netherlands and Belgium, Strava Festive 500 participation in 2017 was lower than in 2016 and in three of them even 2016 participation was lower than in 2015. This shows a clear trend, that the market size is dramatically decreasing on a global scale. So, the question is, why is Strava still growing, even if the growth rate has become very small?
The answer to that question is, that Strava participation continues to grow in non-developed markets. The 13 major markets have accounted for 72% of all Festive 500 riders in 2013, but only for 55% of all riders in 2017. Again, there are two causes for this development; one being the addition of new riders in less developed markets, and one being a higher Strava penetration rate in these markets. With the addition of new languages on Strava in recent years, we assume that the penetration rate in these markets has much more influence on this development than market growth.

Conclusion
Basically, the analysis of the Strava Festive 500 data confirms, what has been in the news throughout the last two years: The bicycle market size is decreasing in developed markets. Sales in non-developed markets may increase, however in terms of volume they can not compensate what has been lost in the major markets.
The same is true for the development of Strava. However, the trend has been mitigated by Strava successfully increasing penetration rate in non-developed markets. The question is, how much longer Strava will be able to increase penetration rate further when the supply of new riders is quickly drying up. The key to more growth lies in the development of non-developed market with huge potential, notably China and India. And new target groups. However, looking at Strava Festive 500 data from the last five years there is little reason for hope. Road racing continues to be a sport enjoyed by men in their forties and fifties, mostly from Western countries, something that hasn’t changed very much since the first bicycle race almost 150 years ago in Paris.


![First light on the Laliderer Walls [explored 2026/08/01]](https://live.staticflickr.com/65535/55432613994_1ccbce1b9b_s.jpg "First light on the Laliderer Walls [explored 2026/08/01]")


Very nice analysis of the Strava heatmap, and it is welcome to read in English.
This is of course very valuable market research data. Did you figure out how many high-end road bicycles were sold to employees of the CIA in Langley, Virginia, and where they go when they ride home from work? And are there any MTBs being used at bases outside Kandahar … or is the rideable course too short before you get into Taliban sniper range? It might help to figure out whether these markets are saturated or not.
In fact you can see the runnig tracks arround US Bases in Afghanistan. And soldiers stationed there defined segments and put their full names into the KOM list. You do not even need a Strava Premium account to get your hands on this information.